
FXで1年間550%の利益?PythonでFXシストレをシミュレーションした結果
では2016年の1年間をシミュレーションしてみました。
取得できたデータは2001年からありますので、
各年毎にシミュレーションしてみましたので
その結果を掲載します。
いずれも1月1日に10万円の資産でスタートし
翌年の1月1日になった時点での最終資産をシミュレーションしました。
このシミュレーションには手数料が入っていませんので
注意が必要です。
| 年 | 最終資産 | トレード回数 | 勝ち回数 | 負け回数 | 勝率 |
|---|---|---|---|---|---|
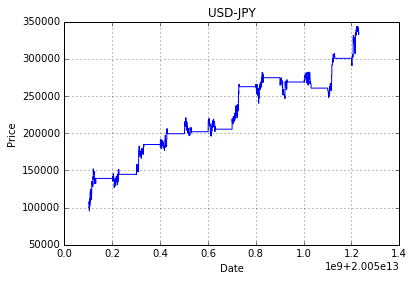
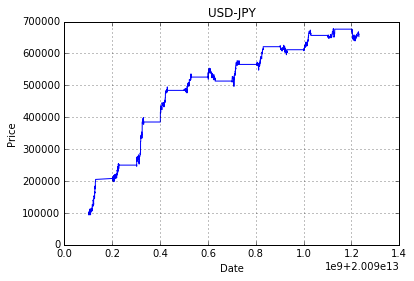
| 2001年 | 709,300円 | 1070 | 633 | 437 | 59.2% |
| 2002年 | 638,700円 | 1007 | 586 | 421 | 58.2% |
| 2003年 | 396,400円 | 735 | 413 | 322 | 56.2% |
| 2004年 | 594,100円 | 847 | 498 | 349 | 58.8% |
| 2005年 | 332,600円 | 726 | 401 | 325 | 55.2% |
| 2006年 | 435,500円 | 750 | 426 | 324 | 56.8% |
| 2007年 | 644,400円 | 905 | 537 | 368 | 59.3% |
| 2008年 | 1,140,800円 | 1619 | 953 | 666 | 58.9% |
| 2009年 | 653,000円 | 1177 | 682 | 495 | 57.9% |
| 2010年 | 511,200円 | 683 | 404 | 279 | 59.2% |
| 2011年 | 413,200円 | 402 | 244 | 158 | 60.7% |
| 2012年 | 145,200円 | 312 | 162 | 150 | 51.9% |
| 2013年 | 530,000円 | 913 | 530 | 383 | 58.1% |
| 2014年 | 263,000円 | 546 | 300 | 246 | 54.9% |
| 2015年 | 464,300円 | 723 | 418 | 305 | 57.8% |
| 2016年 | 656,900円 | 1081 | 617 | 464 | 57.1% |
以下のグラフは2001年~2016年の各年の資産額推移グラフです。
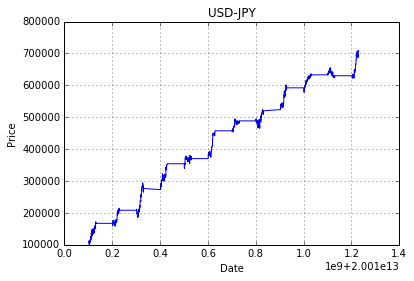
2001年
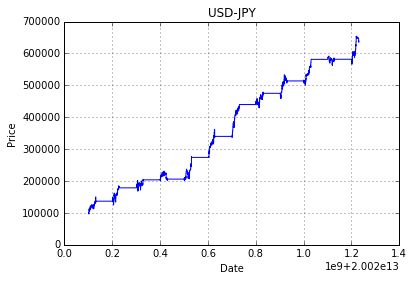
2002年
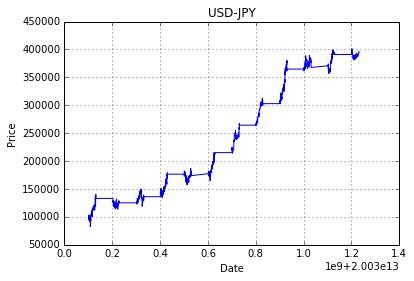
2003年
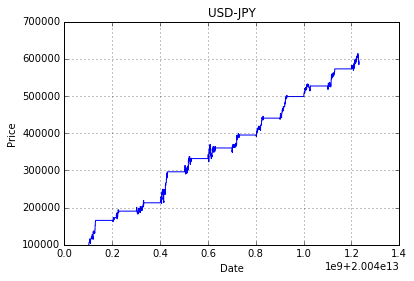
2004年
2005年
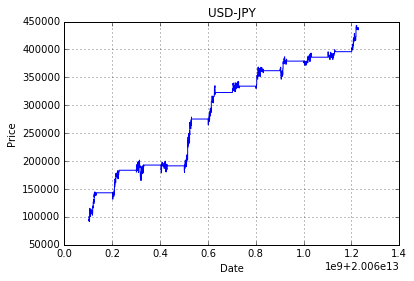
2006年
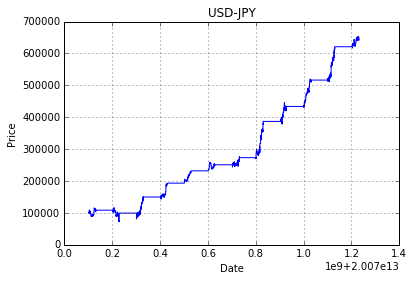
2007年
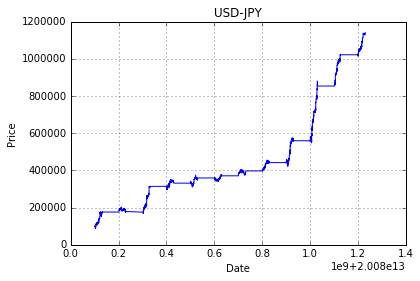
2008年
2009年
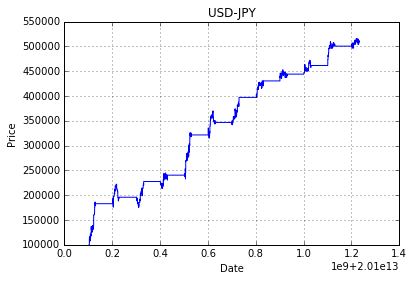
2010年
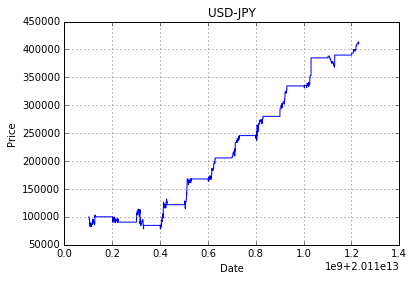
2011年
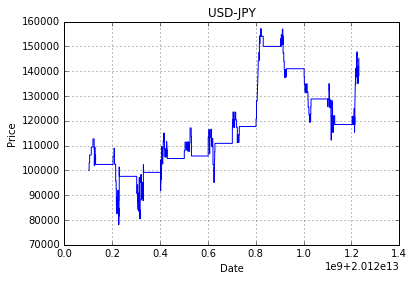
2012年
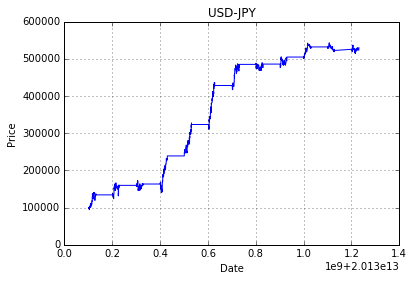
2013年
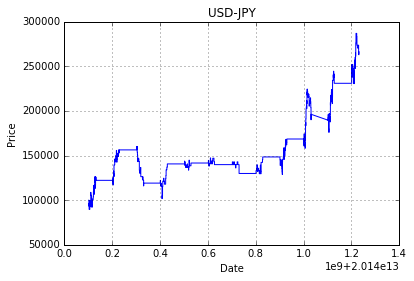
2014年
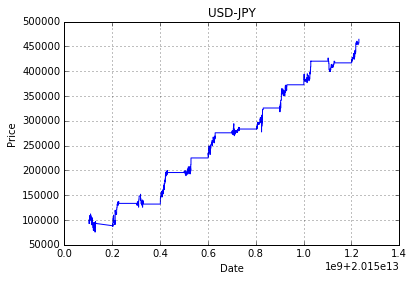
2015年
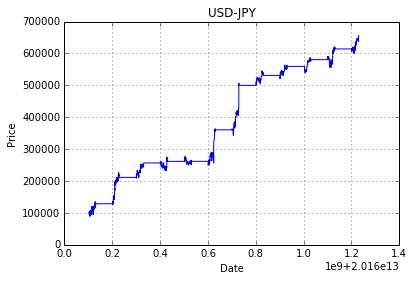
2016年
マイナスになる年はありませんでしたが、
年ごとに最終資産額に大きな開きが出ました。
勝率は52%~61%の間でしたが、
最終資産額に大きな差が出たのは
トレード回数の差によるものでしょう。
2012年は資産の増加額は45,200円で、
この年のトレード回数は312回でした。
勝率も51.9%と一番低い年でした。
一方、資産増加額が一番多かったのが2008年で、
1,040,800円と10倍以上増えています。
この年のトレード回数は1619回と一番多くなっています。
2012年は民主党から自民党に政権交代した年ですね。
年の前半は急激に円高に進み、
後半(11月)には衆議院が解散して選挙、
政権交代があり、今度は逆に円安が進みました。
為替には大きな動きがありましたが、
一方向に向かって大きな流れ(トレンド)が
あった年と言ってもいいでしょう。
2008年はリーマンショックの年ですね。
為替も上下に振れた年でした。
ボリンジャーバンドによるトレードは
±2σに現在価格が近づくと反発するだろうという
買われ過ぎ・売られ過ぎをシグナルとするので
大きなトレンドがある時期には向いていないということですね。
こういう時期はどちらに動くのかが明確にわかりますので
裁量トレードの方が大きく儲かるでしょう。